
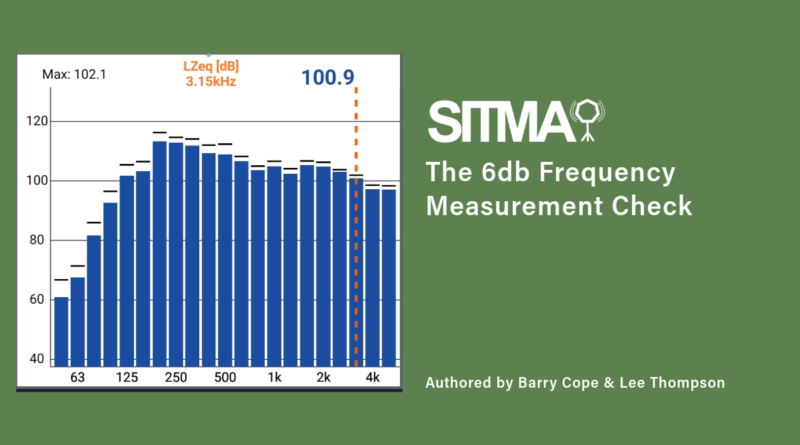
According to BS EN ISO 140-4:1998, when conducting sound insulation tests, the generated noise should have a steady & continuous sound spectrum in the 3rd octave bands in the 100Hz through to 3.15kHz frequency bands. BS EN ISO 140-4:1998 states that there should be no more than a 6-decibel difference in parallel frequencies in the source room.
Why is this important?
Well, it all comes down to accuracy. If there are unexpected spikes or irregularities in the noise at different frequencies, it can introduce uncertainty into both the source and receiver measurements. And that uncertainty can throw off the overall test results. If you accidently measure a constructive wave, a wave that ‘builds’ and increases the sound pressure level at a single frequency, your DnT (measured result) will be higher than expected, causing you to report a better result. The opposite happens where deconstructive waves are present, you may have a low spot in your measurements that would not be reciprocated in your receive room, causing you to report your result as being too low, or failing.
Adhering to this rule not only ensures precision but also makes the testing process more robust and reliable.
If you’re wondering how to make sure you meet the 6dB Rule without a hitch, here are some helpful tips:
1. Source Loudspeaker Positions
When setting up your loudspeaker for testing, consider placing it in the corner of the room. Specifically, aim for the corner that’s farthest away from the separating wall. Make sure to position the loudspeaker at a distance of at least 0.5m (but ideally no more than 1.0m) from the corner wall boundaries.
This arrangement serves a couple of important purposes. First, it promotes repeatability in your measurements, ensuring that your testing is repeatable and therefore results are consistent. Second, it makes the best use of the available room space for taking measurements.
For more insights and examples of different room shapes and configurations, you can refer to BS EN ISO 140-14:2014. It’s a valuable resource that can provide you with further guidance on optimising your testing setup.
2. Taking Measurements
Following a methodical approach will improve repeatability, whilst ensuring that measurements are taken from different planes, and improve keeping track of each measurement position to identify any unusual readings that might affect the accuracy of the 6dB level tolerance.
For fixed measurements take a minimum of five measurements over a 30-second time period, allowing a minimum of 6 seconds for each measurement. Note: these are the minimum requirements; taking more than 5 measurements or over 6 seconds may likely improve the frequency levels and accuracy of measurement.
If you’re handling the microphone, be sure to keep it away from your body. Also, keep your back to the wall. This will ensure you are 0.5m away from the wall boundaries (particularly in smaller rooms).
Ensure you sample the entire room, going down to approximately knee height and being aware of your maximum height. Remember, in a 2.4m ceiling height, the microphone must be less than 0.5m away, meaning 190cm. This is around 6 ft tall. If you are 6ft tall, never lift the microphone above your head in an average ceiling height!
Maintain a pattern resembling a cross, known as a quincunx. This involves taking measurements in all four corners of the room and one in the centre. After each measurement, adjust the microphone height position.
Keep the microphone more than 1.0m away from the loudspeaker and maintain a consistent distance of about 0.5m from all room boundaries and surfaces. The loudspeaker ‘near-field’ is the most turbulent area of the room for sound pressure level. Staying away from the speaker will ensure you have better results.
Moving Microphone Measurements:
For moving microphone measurements take 2 measurements are taken at a minimum of 15 seconds. The standards will allow you to do less, but in our experience, two measurements of 30 seconds each (as required by England and Wales Approved Guidance Document E) will produce better results.
Ensure that the microphone’s sweep radius is a minimum of 0.7m. This distance allows for an adequate coverage of the measurement area. Try to sample as much of the room as possible to cut through any constructive or deconstructive waves and avoid them affecting your results.
3. Check the data
It’s crucial to verify your data to ensure that the 6dB frequency levels have been achieved accurately. Different sound level meter (SLM) manufacturers have varying methods for accessing and displaying this data, so it’s essential to understand how and where to check.
For instance, with the NTi XL2 Sound Level Meter, the data is readily displayed on the screen as the measurement is taken. To check each frequency level, you’ll need to scroll across the table, viewing all the frequency bars before the data is saved. If any of the frequency bands fall outside the 6dB tolerance, the data isn’t saved, and the measurement must be retaken.
On the other hand, with Norsonic models like the NOR-140, 145, & 150 and the Bruel and Kjaer 2250/2270’s, the data is accessible via another screen display presented as a vertical table. Some of these sound level meters use a smiley face system, with unhappy faces indicating non-compliances with the data.
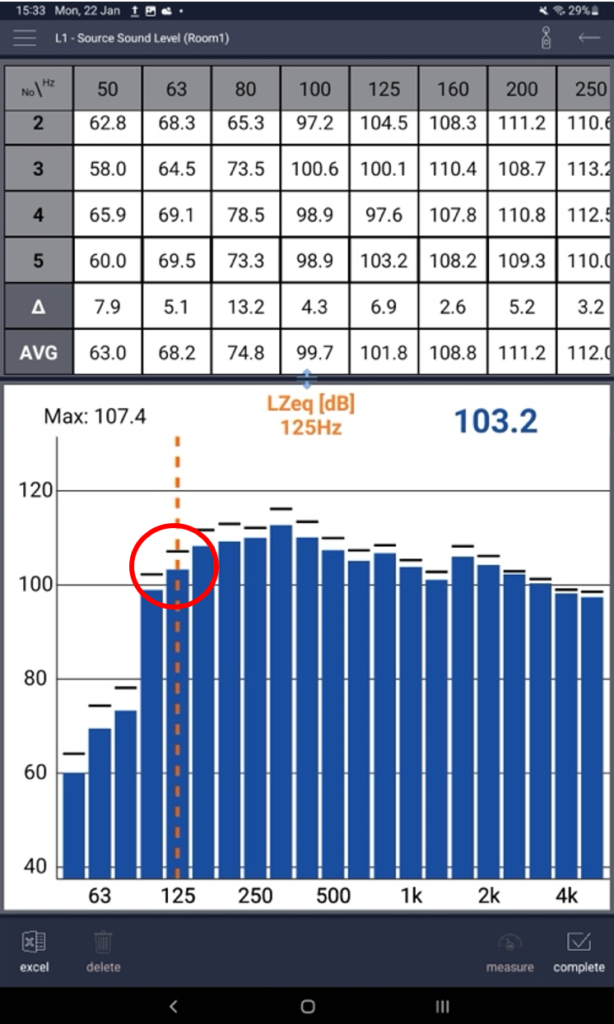
Svantek models, however, show this data through a tablet interface as a horizontal table for individual measurements, with an average value displayed at the bottom of the measurements.
Here are some key steps to consider:
Ensure you examine all the frequencies from 100Hz to 3.15kHz. Keep in mind that certain SLMs may only display a limited number of frequency bands simultaneously due to screen size limitations.
If you’re taking more than one 30-second (minimum) measurement, carefully review each individual measurement. Occasionally, you may find one or two measurements that deviate significantly from the others, causing the final average to exceed the 6dB tolerance. In such cases, it’s possible to remove and retake these individual measurements. This underscores the importance of maintaining a methodical approach to your measurement positions, enabling you to recall and adjust positions where odd measurements were initially taken. For example, if you originally measured at eye height, try measuring at waist height or vice versa to achieve more accurate results. If the measurement(s) are taken using the sweeping method then simply adjust the standing position from when the measurement was originally taken.
4. If your Parallel frequencies are not within 6dB
After the data has been analysed you may find the parallel frequency bands are not within the required minimum 6dB tolerance. Here are some tips to help resolve this:
- Moving or adjusting of your loudspeaker can make a substantial difference when it comes to modal excitation, which, in turn, has a direct effect on the sound levels within the source room.
- Consider altering the loudspeaker a bit further away from the room’s wall boundaries, perhaps by a modest 0.1m to 0.2m. It might seem like a minor adjustment, but it can surprisingly result in substantial changes in the average sound pressure levels. A subtle manoeuvre has the potential to tweak the average sound pressure level by up to 5 dB.
- Keep in mind, it might not produce the desired outcome on your first attempt, it may even have an adverse effect. If your initial adjustment does not work; don’t get discouraged. Simply try by moving it further out, adjust its height, or shift it horizontally (making sure to maintain those crucial 0.5-meter distances).
- Also take note of any features in the room, as not all rooms are square white boxes. i.e. the room may have a bay window area, a large glazed area, or the room may be a kitchen/diner and the only option is to naturally place the loudspeaker in the kitchen area. All of these feature may have a negative or positive impact on the measurements.
- Utilize pre-made diffuser boards placed on stands.
- To enhance their effectiveness, consider adding some absorption material.
- Additionally, if you have access to plasterboard on-site, it can be a cost-effective solution. Simply place large pieces of plasterboard around the rooms, specifically breaking up the ‘straights’ in the room to divert constructive and deconstructive waves.
- If your room includes cupboards or other storage areas, ensure that their doors are open during testing.
- Furniture can also have a positive impact on room modes. The placement of furniture items strategically can help modify the acoustic characteristics of the space.
- This would need to noted on the report as a test exception.
- If you have access to a graphic equalizer, you can manually adjust settings as needed.
- Different amplifiers and remote controls offer various settings that you can experiment with. However, it’s generally advisable to stick with your preferred settings to maintain repeatability.
- Keep in mind that altering the source noise spectrum won’t change the behaviour of the sound source spectrum or eliminate room modes. However, it’s still valuable to check that your amplifier, noise generator, and loudspeaker settings are functioning correctly.
After making these refinements, take your measurement(s) once again and reevaluate the post-measurement data. Think of this as a valuable learning experience. Each adjustment helps you better understand how to optimise your setup for the best results.
It’s important to note that any changes or additions made to the room should be carefully documented in the test report. This documentation serves two crucial purposes: transparency and repeatability. It allows anyone reviewing the results to understand the modifications made to the room and ensures that future tests can be conducted under similar conditions for consistent and reliable outcomes.
5. Notes, Photos and Test Deviations
It is highly recommended to take detailed notes and photos when conducting sound insulation testing, especially in the context of the parallel 6dB frequency check and varying room aspects such as room shape, furnishings, or specific architectural features like glazed areas or kitchen cupboards. These records serve as invaluable documentation for several critical reasons.
Firstly, notes and photos provide a comprehensive visual and written record of the testing environment. When examining the results of a 6dB frequency check, having visual documentation of the room’s layout, any obstacles, or unique features can aid in post-analysis. It allows testers to correlate specific variations in sound insulation performance with the physical characteristics of the room, helping to pinpoint the root causes of any deviations from expected results.
Additionally, when testing in diverse room types, such as odd-shaped rooms or those with various furnishings, the notes and photos can act as a reference point for repeatability. They ensure that subsequent tests are conducted under similar conditions, providing consistency in the testing process. Moreover, these records facilitate effective communication with stakeholders, as they offer a clear visual representation of the testing environment, making it easier to discuss and address any issues or improvements needed for sound insulation. In summary, taking notes and photos during sound insulation testing enhances both the precision of analysis and the ability to replicate testing conditions across different room scenarios, ultimately contributing to more accurate and reliable results.