

Flow of air going through the fan
When the flow pressure readings are converted to flow based on the equipment calibration variables this flow is adjusted by the difference between the air density that the calibration variables are given at on the calibration certificate and that of the air going through the fan. This gives us the flow of air going through the fan corrected to the test conditions.
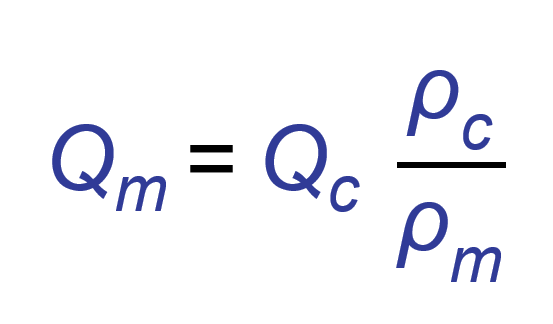
| Qm | The flow of air going through the fan adjusted by the air density of the air going through the fan |
| QC | The flow of air calculated from the flow pressure readings using the calibration variables |
| ρC | The air density at calibration |
| ρm | The air density of the air going through the fan |
The Air density that you use for the air going through the fan depends whether you are pressurising or depressurising the building. If you pressurise then the air is being drawn from outside the building through the fan to inside the building so the external air density (ρe) is used. if you are depressurising the air is being drawn from inside the building through the fan to the outside of the building so the internal air density (ρi) is used.
| Location | Temperature | Barometric Pressure | Air Density |
|---|---|---|---|
| Internal (ρi) | 20°C | 1000.00 hPa | 1.1884 |
| External (ρe) | 10°C | 1000.00 hPa | 1.2303 |
| Calibration (ρc) | 20°C | 1013.25 hPa | 1.2041 |
Depressurise
| Reading | 1 | 2 | 3 | 4 | 5 | 6 | 7 | 8 |
|---|---|---|---|---|---|---|---|---|
| Flow in m3/h | 711.5 | 655.0 | 605.0 | 557.0 | 502.6 | 444.4 | 368.2 | 289.7 |
| Qm | 720.9 | 663.7 | 613.0 | 564.4 | 509.2 | 450.3 | 373.1 | 293.5 |
The air density on the depressurisation test is lower than at calibration therefore it’s easier to move air through the fan under these conditions so a greater volume of air is moved than at calibration.
Pressurise
| Reading | 1 | 2 | 3 | 4 | 5 | 6 | 7 | 8 |
|---|---|---|---|---|---|---|---|---|
| Flow in m3/h | 711.5 | 655 | 605 | 557 | 502.6 | 444.4 | 368.2 | 289.7 |
| Qm | 696.3 | 641.1 | 592.1 | 545.1 | 491.9 | 434.9 | 360.4 | 283.5 |
The air density on the pressurisation test is higher than at calibration therefore it is more difficult to move the air under these conditions through the fan so a lower volume of air is moved than at calibration.
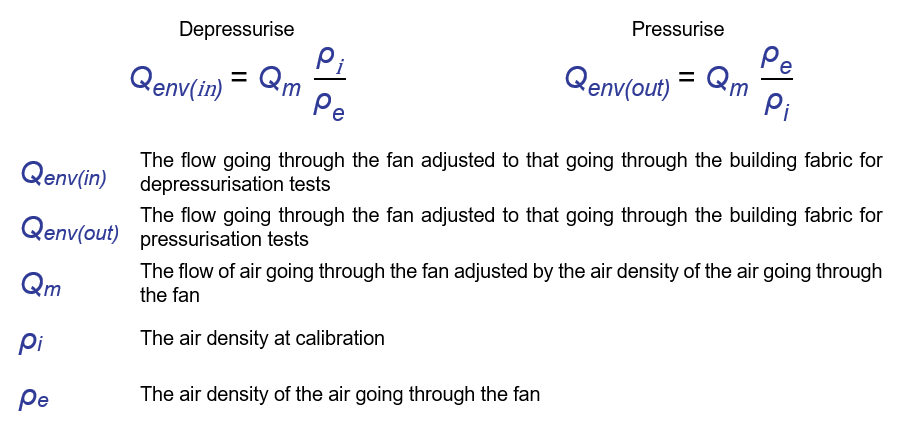
Flow of air going through the building fabric
This flow is then converted again by looking at the difference of the air density of the air going through the fan and that of the air going through the building. This gives is the flow of air going through the building fabric and there are two equations with one for when you are depressurising and the other for when you are pressurising.
Depressurise
| Reading | 1 | 2 | 3 | 4 | 5 | 6 | 7 | 8 |
|---|---|---|---|---|---|---|---|---|
| Flow in m3/h | 711.5 | 655.0 | 605.0 | 557.0 | 502.6 | 444.4 | 368.2 | 289.7 |
| Qm | 723.9 | 666.4 | 615.5 | 566.7 | 511.3 | 452.1 | 374.6 | 294.7 |
| Qenv(in) | 696.3 | 641.1 | 592.1 | 545.1 | 491.9 | 434.9 | 360.4 | 283.5 |
Pressurise
| Reading | 1 | 2 | 3 | 4 | 5 | 6 | 7 | 8 |
|---|---|---|---|---|---|---|---|---|
| Flow in m3/h | 711.5 | 655 | 605 | 557 | 502.6 | 444.4 | 368.2 | 289.7 |
| Qm | 696.3 | 641.1 | 592.1 | 545.1 | 491.9 | 434.9 | 360.4 | 283.5 |
| Qenv(out) | 720.9 | 663.7 | 613.0 | 564.4 | 509.2 | 450.3 | 373.1 | 293.5 |
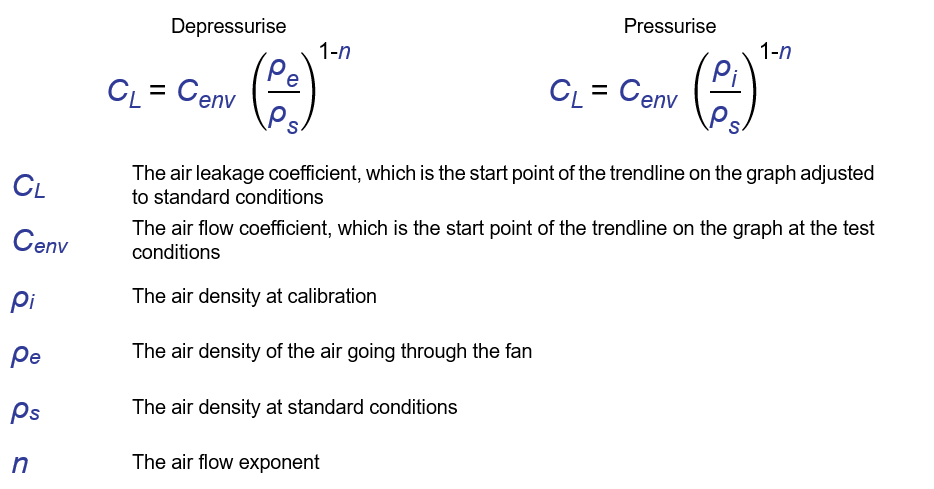
Adjustments of the trendline through the readings to standard conditions
The trendline through the data is calculated at the conditions on the test but to compare tests with each other they need to be corrected back to a standardised air density. If this wasn’t done you would get different results on the same property depending what time of year it was tested. The Air Flow Coefficient (Cenv) is the start point of the trendline and this if what gets adjusted to give us the Air Leakage Coefficient (CL)
For the depressurisation test if you were to calculate the flow at 50Pa (Q50) from the Cenv it would give you a value of 651.191 m3.h-1 whereas with the CL corrected back to standardised conditions this is 653.298 m3.h-1.
For the pressurisation test if you were to calculate the flow at 50Pa (Q50) from the Cenvit would give you a value of 676.943 m3.h-1 whereas with the CL corrected back to standardised conditions this is 679.131 m3.h-1.
These are a minor adjustment because the environmental readings are not extreme relative to the standard air density.